IGF-1 Z-Scores: Questions That Help You Read a Laboratory Report
A fictional report containing both “150 ng/mL” and “SDS −0.6” illustrates two different aspects of the result. The concentration is the measured quantity; the SDS describes its position in the reference system used by that laboratory. Understanding the two fields helps you ask about a score without treating it as a second hormone measurement.
A standardized position is not a concentration
A concentration describes the measured amount relative to volume. An SDS places a result within a specified reference distribution. In Chanson and colleagues’ comparison of six IGF-I assays, the reference calculations accounted for assay, age and sex. The useful reading question is therefore not simply whether a z-score looks large or small, but which method and comparison group were used. A score copied without those details has lost part of its meaning. In a standardized reference system, zero marks its centre, positive scores lie above it and negative scores below it. These signs describe relative position; they are not diagnostic cutoffs. [1]
Do not rebuild the laboratory score with a generic formula
The study found skewed IGF-I distributions and used a transformation before standardization. That is why inserting an internet average and standard deviation into a familiar formula is not a reliable way to recreate a laboratory SDS. A calculator can also be the wrong one if its assay or reference population does not match. Ask the reporting laboratory to explain its score; do not treat a homemade calculation as a corrected result. [1]
Two fields, and one deliberately unfilled gap
All entries are invented to illustrate record structure. The concentration/SDS pair is not a validated conversion example.
| Field | Older report in the example | Newer report in the example |
|---|---|---|
| Specimen date | 3 June 2026 | 1 October 2026 |
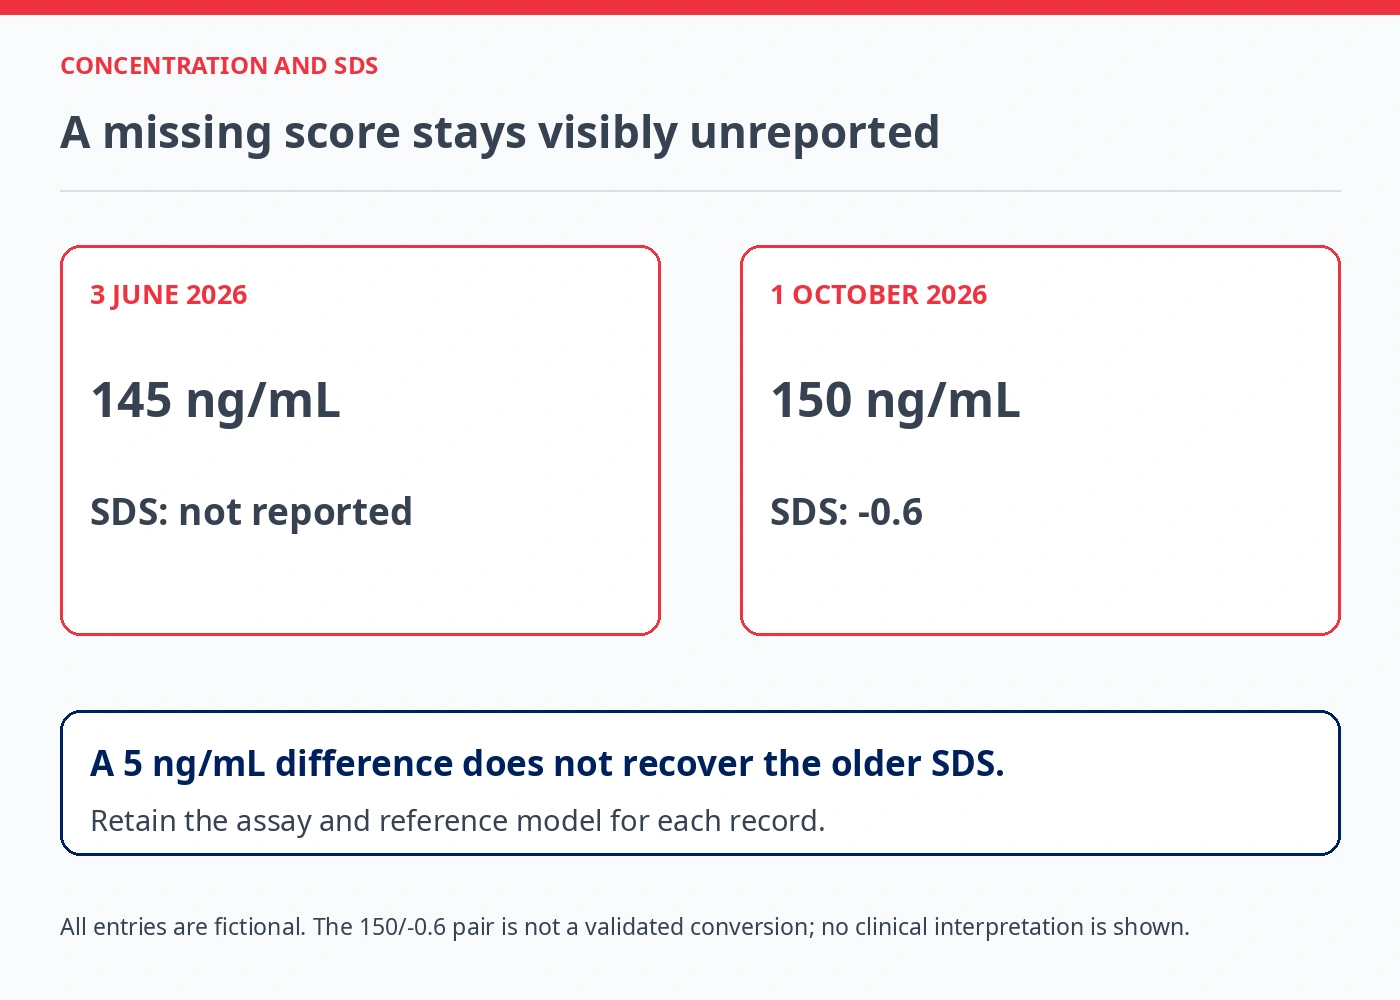
| Concentration | 145 ng/mL | 150 ng/mL |
| Reported SDS | Not reported | −0.6 |
| Assay/reference note | Original report retained; model not identified | Original report retained; model still needs confirmation |
| What can be compared now? | No reported SDS to compare | Do not invent an older score from the newer record |
A small difference in concentration does not supply the missing SDS
The two invented concentrations differ by 5 ng/mL. That arithmetic cannot tell you the older score, whether the methods match, or whether the change is clinically meaningful. A useful note is: “The newer report includes an SDS; can you explain its reference system and whether comparison with the older report is appropriate?”
Keeping the older field visibly unreported preserves the question. Choosing a calculator because its result looks reassuring would hide it.
When the assay also changes, the comparison needs the checks in Comparing IGF-1 Results From Different Laboratories
Keep a reported score distinct from a score you cannot recover
The invented records in this example illustrate a common filing problem: a newer report includes an SDS, while an older one does not. Copy each field as it appears. A missing score remains “not reported”; filling it with a calculation from the newer report would create information the older laboratory did not provide.
For the illustrative SDS of −0.6, the minus sign places the score below the centre of its stated reference system. It is not a concentration of minus 0.6 ng/mL, a percentage deficit, or a diagnostic label. Interpreting the position still depends on the assay, reference model and clinical question.
If the uncertainty concerns what the assessment can establish, see When an Adult Growth Hormone Diagnosis Is Uncertain: Questions for Follow-Up
A score needs its own reference system
No diagnostic cutoff or conversion calculator is provided. Standardization does not remove every difference between laboratories or make a score a diagnosis.
Sources and reading context
- Chanson and colleagues 2016 IGF-I reference values for six immunoassays — Primary assay-comparison evidence; not a conversion rule